Conservation Fast Facts
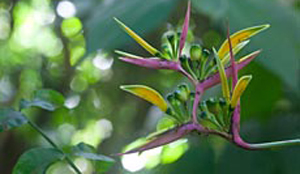
Tropical biodiversity: a superabundance
- A single hectare (100 metres X 100 metres) in the tropical rain forest of Brazil yielded 450 species of tree. [1] (Versus 180 species of trees in all of Canada.) [2]
- The tropics are home to "biodiversity hotspots" in which 44% of vascular plant species and 35% of vertebrates are found in less than 1.5% of the earth's land. [3]
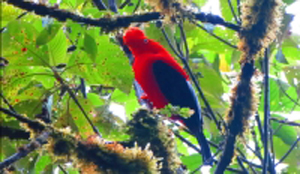
- A single rainforest reserve in Peru is home to more species of birds than are found in the entire United States. [4]
- The number of species of fish in the Amazon exceeds the number found in the entire Atlantic Ocean. [4]
- One single tree in Peru was found to harbor 43 different species of ant. [4]


Ecosystem services: the economic value of nature
- Tropical forests provide a host of ecosystem services, including protecting watersheds from erosion and evaporation, nutrient cycling and providing habitat for species critical for pollination of crops. [5]
- Forests produce clouds and rainfall through evapotranspiration, a process essential for agriculture. [6] The Amazon rainforest, for example, is responsible for rainfall on an intercontinental scale. [7]
- A famous study published in Nature in 1997 estimated the value of ecosystem services worldwide at $33 trillion per year; higher than world GDP at $27 trillion (both figures in 1994 dollars). [8]
- Over 75% of the world's drinking water comes from forested areas. [9]
- Existing forests and their soils absorb one quarter of all carbon emissions. [9]
- More than 20 percent of all oxygen in the atmosphere is produced in the Amazon Rainforest. [9]
- Deforestation contributes 15-17% of total carbon emissions - more than all the world's ships, cars, trains and planes. [9] Avoiding deforestation is a cost effective means to lower carbon emissions. [9]
- One study found that protected forests in Brazil provided ecosystem services worth 50% more than agriculture would have in the same areas. [9]
- If land use conversion continues at the same rate as in the last 60 years, the cost of lost ecosystem services will amount to US$2 trillion to 4.5 trillion per year. [10] The U.S. National Cancer Institute has identified 3000 plants that are active against cancer cells; 70% are found in rainforests. [10]
Loss of biodiverity & natural ecosystems: where and why
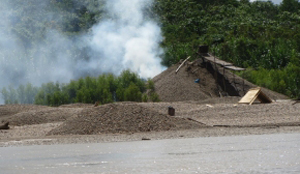
Causes of deforestation [11]
- agricultural expansion
- infrastructure expansion - roads, human settlements etc.
- wood extraction for fuel, construction material, etc.
Habitat loss
- Over 6 million hectares of primary (old growth) forest are lost each year around the world - an area larger than Nova Scotia. [12]
- Forests once covered more than 40% of the earth's land surface. This has been reduced by over 1/3, with most loss occurring since the 1950's. [12]
- One and a half acres of rainforest are lost every second. [13]
Illegal bush meat and trade in threatened species
Overhunting is the second most important cause of extinctions in the tropics, next to habitat loss. [14] Several large mammal species in Africa, e.g. the Black Rhinoceros, face complete extinction due to poaching. [15]
Invasive species
- Since the 17th Century, alien species have contributed directly to nearly 40% of all animal extinctions. [16]
- The combined economic losses due to introduced invasive species for six countries (US, UK, South Africa, India, Brazil and Australia) is estimated at $316 billion per year. [17]
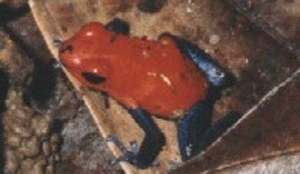
Frogs faring poorly
1,910 of the planet's 6,312 amphibian species are in danger of extinction, making them the most threatened group known to date. [17]
Marine ecosystems under seige
- Oceans cover 70% of our planet, and host a vast diversity of habitats that are home to 32 of the world's 34 phyla. [18]
- Coral reefs provide food, storm protection, tourism and other benefits, yet 70% of coral reefs are threatened or destroyed.xii [18]
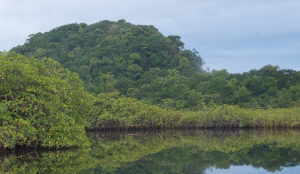
- 35% of mangroves (nurseries to marine life) have been lost in just 20 years.xii [18]
- Over 70% of the world's fish stocks are either fully exploited or depleted. [19]

What's going right
- Costa Rica has reduced its deforestation rate to zero, and one study found that local economies have benefited from the establishment of more protected areas. [20]
- In the last ten years Brazil has given protected status to 500,000 km2 of Amazon rainforest. [20]
- Across the world there are now numerous local conservation organizations as well as international ones actively conserving nature. In Sub-Saharan Africa, for example, there are 280. [21]
- Protection of watersheds through ecosystem service payments is growing rapidly &mdash around the world at least 288 programs existed in 2008, up from just 51 in 2000. [22]
- At least 72 payment systems for biodiversity conservation, such as biodiversity banks' and offset programs, exist around the world, with a market value of USD 2.4-4.0 billion per year at minimum. [23]
- Voluntary carbon markets are growing globally; conservation of forests for their carbon value made up the largest share of these markets in 2010. [24]
- A century ago only a minute amount of land was held in nature or hunting reserves; By 2008, there were over 120,000 protected areas covering 21 million km2 of land and sea, an area more than twice the size of Canada. [25]
- Globally, the net rate of conversion of some ecosystems has begun to slow, and in some regions ecosystems are returning to more natural states. [26]


Money and conservation
- With an annual investment of US$45 billion in protected areas we could protect natural services worth some US$5 trillion: an extremely good benefit-cost ratio of 100:1. [27]
- An effective global system of nature reserves would cost about 2% of the annual expenditure on environmentally harmful subsidies. [28]
- A comprehensive global conservation program that incorporated biodiversity into all major natural resource sectors could be launched for about 20% of the cost of these subsidies. [28]
| annual amount $US billions | Year | Ref. | |
|---|---|---|---|
| Value of ecosystem services | $33,000 | 1994 | [28] |
| Amount needed for comprehensive global conservation | $300 | 1996 | [28] |
| Amount needed for conservation of an ecologially represenative global network of protected areas | $27 | 1996 | [28] |
| Amount needed for proper management of existing reserves | $8 | 1996 | [28] |
| Amount being spent on reserves | $6 | 1996 | [28] |
| Shortfall in conservation funding (Developed world) | one-third | 2000 | [29],[30] |
| Shortfall in conservation funding (Developed world) | one-twentieth | ||
| Compared With | |||
| World GDP | $26,842 | 1994 | [31] |
| World GDP | $69,994 | 2011 | [31] |
| Worldwide military spending | $1,630 | 2010 | [32] |
| Environmentally harmful goverment subsidies, world total | $1,000 | 1998 | [32] |
| Worldwide lottery ticket sales | $262 | 2011 | [33] |
| Agricultural subsidies | $55 | 2010 | [34] |
| Agricultural subsidies for corn alone | $8 | 2000 | [35] |
i Figures are in current dollars (i.e. current to respective year), rather than constant dollars.
ii Expenditure on terrestrial reserves as a proportion of estimated requirement for an effective network (covering 15% of land area).
The Bottom Line
Conservation, especially in the tropics, is the greatest bargain and wisest investment for the future. Every conservation gain now makes a difference and will result in more of the world's hugely valuable natural heritage surviving for future generations.
References
- Thomas, W.W. and A. M. Carvalho. 1993. Estudo fitossociologico de Serra Grande, Uru uca, Bahia, Brasil. XLIV CongressoNacional de Bot nica. 24-30 January 1993. Resumos Vol. 1:224. Cited in Voeks, R.A. 1996. Tropical forest healers and habitat preference. Economic Botany, 50, 381-400.
- Natural Resources Canada. The Atlas of Canada: Tree Species by Ecoregion. Accessed 08/12. [link]
- Myers, N, R.A. Mittermeler, C.G. Mittermeler, G.A.B. da Fonseca & J. Kent. Biodiversity hotspots for conservation priorities. Nature, 403, 853-858. Can be found at: [link]
- Richards, P. W. 1996. The Tropical Rain Forest, 2nd ed. Cambridge University Press: Cambridge, UK.
- The United Nations Convention on Biological Diversity. Ecosystem Services Factsheet. Accessed 08/12 [link]
- Portela, R. and I. Rademacher. 2001. A dynamic model of patterns of deforestation and their affect on the ability of the Brazilian Amazonia to provide ecosystem services. Ecological Modelling, 143, 115-146.
- The Economist. 2010. Seeing the wood: A special report on forests. Septemer 25, 2010; 16 pages.
- Costanza, R., R. d'Arge, R. de Groot, S. Farber, M. Grasso, B. Hannon, K. Limburg, S. Naeem, R. V. O'Neill, J. Paruelo, R. G. Raskin, P. Sutton, and M. van den Belt. 1997. The value of the world's ecosystems services and natural capital. Nature 387:253-260.
- The United Nations Convention on Biological Diversity. Forest Factsheet. Accessed 08/12. [link]
- TEEB The Economics of Ecosystems and Biodiversity for National and International Policy Makers Summary: Responding to the Value of Nature 2009. Accessed 08/12. [link]
- Geist, H.J. & E.F. Lamblin. 2002. Proximate causes and underlying driving forces of tropical deforestation. BioScience, 52, 143-150.
- IUCN. 2011. Why is biodiversity in crisis? Accessed 08/12. [link]
- Myers, N. 1995. The world's forests: Need for a policy appraisal. Science, 268, 823-824.
- Bodmer, R.E., J.F. Eisenberg, and K.H. Redford. 1997. Hunting and the likelihood of extinction of Amazonian mammals. Conservation Biology 11:460-466.
- Hillman, K., and E. Martin. 1979. Will poaching exterminate Kenya's Rhinos? Oryx 15:131-132.
- The United Nations Convention on Biological Diversity. Invasive Alien Species Factsheet. Accessed 08/12. [link]
- Pimentel, D., S. McNair, J. Janecka, J. Wightman, C. Simmonds, C. O'Connell, E. Wong, L. Russel, J. Zern, T. Aquino, and T. Tsomondo. 2001. Economic and environmental threats of alien plant, animal and microbe invasions. Agriculture, Ecosystems & Environment, 84, 1-20.
- The United Nations Convention on Biological Diversity. Invasive Alien Species Factsheet. Accessed 08/12. [link]
- Oliver, P. and R. Metzner; UNFAO. 2005. World inventory of fisheries: Impacts of fishery activities. FAO Fisheries and Aquaculture Department Online. Accessed 08/12. [link]
- Andam, K.S., P.J. Ferraro, K.R. Sims, A. Healy and M.B. Holland. 2010. Protected areas reduced poverty in Costa Rica and Thailand. Proceedings of the National Academy of Sciences, 107, 9996-10007.
- Scholfield, K., and D. Brockington. 2008. Non-governmental organisations and Aftican wildlife conservation: a preliminary analysis. University of Manchester and Newcastle University report available online at [link]
- Stanton, Tracy; Echavarria, Marta; Hamilton, Katherine; and Ott, Caroline. 2010. State of Watershed Payments: An Emerging Marketplace. Ecosystem Marketplace. [link] Accessed 10/12.
- Madsen, Becca, Nathaniel Carroll, Daniel Kandy, and Genevieve Bennett, 2011 Update: State of Biodiversity Markets. Washington, DC: Forest Trends, 2011. [link] Accessed 10/12.
- Peters-Stanley, M., K. Hamilton, T. Marcello, and M. Sjardin. 2011. Back to the Future: State of the Voluntary Carbon Markets 2011. A Report by Ecosystem Marketplace & Bloomberg New Energy Finance. Accessed 10/12. State of voluntary carbon agreements: [link]
- Biodiversity Indicators Partnership. Coverage of Protected Areas: [link]
- Millennium Ecosystem Assessment, 2005. Ecosystems and Human Well-being: Biodiversity Synthesis. World Resources Institute, Washington, DC.
- Balmford, A., Bruner, A., Cooper, P., Costanza, R., Farber, S., Green, R.E., Jenkins, M., Jefferiss, P., Jessamy, V., Madden, J., Munro, K., Myers, N., Naeem, S., Paavola, J., Rayment, M., Rosendo, S., Roughgarden, J., Trumper, K. and Turner, R.K. (2002) Economic reasons for conserving wild nature, Science 297: 950-953.
- James, A.N., Gaston, K.J and A. Balmford. 1999. Balancing the Earth's accounts. Nature, 401, 323-324.
- Balmford, A., K. J. Gaston, S. Blyth, A. James, and V. Kapos. 2003. Global variation in terrestrial conservation costs, conservation benefits, and unmet conservation needs. Proceedings of the National Academny of Sciences USA 100(3):1046-1050.
- Balmford, A., and T. Whitten. 2003. Who should pay for tropical conservation, and how could the costs be met? Oryx, 37(2): 238-250.
- World Bank, using figures from World Development Indicators & Global Development Finance.
- Stockholm International Peace Research Institute. 2011. Recent trends in military expenditure. Military Spending and Armament. Accessed 08/12. [link]
- Scientific Games Corporation (a NASDAQ listed public company) [link] Accessed 10/12
- EUR-Lex (Access to European Law). 2010. 2010 General budget: Agriculture and rural development. Posted March 17, 2010. [link]
- Environmental Working Group (EWG). Farm Subsidies. Accessed 09/12. [link]
International Conservation Fund of Canada Copyright © 2009-2024
Registered Canadian charity # 85247 8189 RR0001